Challenge
The brand needed to explain a highly technical emergency-power system in a way that felt credible, clear, and easy to scan for decision-makers.

Thor Power Technologies is a multi-page brand website built around the company's Emergency Logistics Grid (ELG®), an AI-assisted emergency power monitoring system designed to improve readiness, response, and recovery. The experience uses a dark, high-contrast visual direction with strong red accents to match the brand's serious, mission-critical positioning. The homepage leads with the ELG message, then walks visitors through the Why, How, and For story so the value proposition is easy to understand. Supporting pages expand the product ecosystem with definitions, hardware variants such as ALPHALINK, BRAVOLINK, and NOMADLINK, and platform terms like VELMA® and KoT. The site also surfaces recent news, partner logos, and direct contact information to build credibility and encourage inquiries.
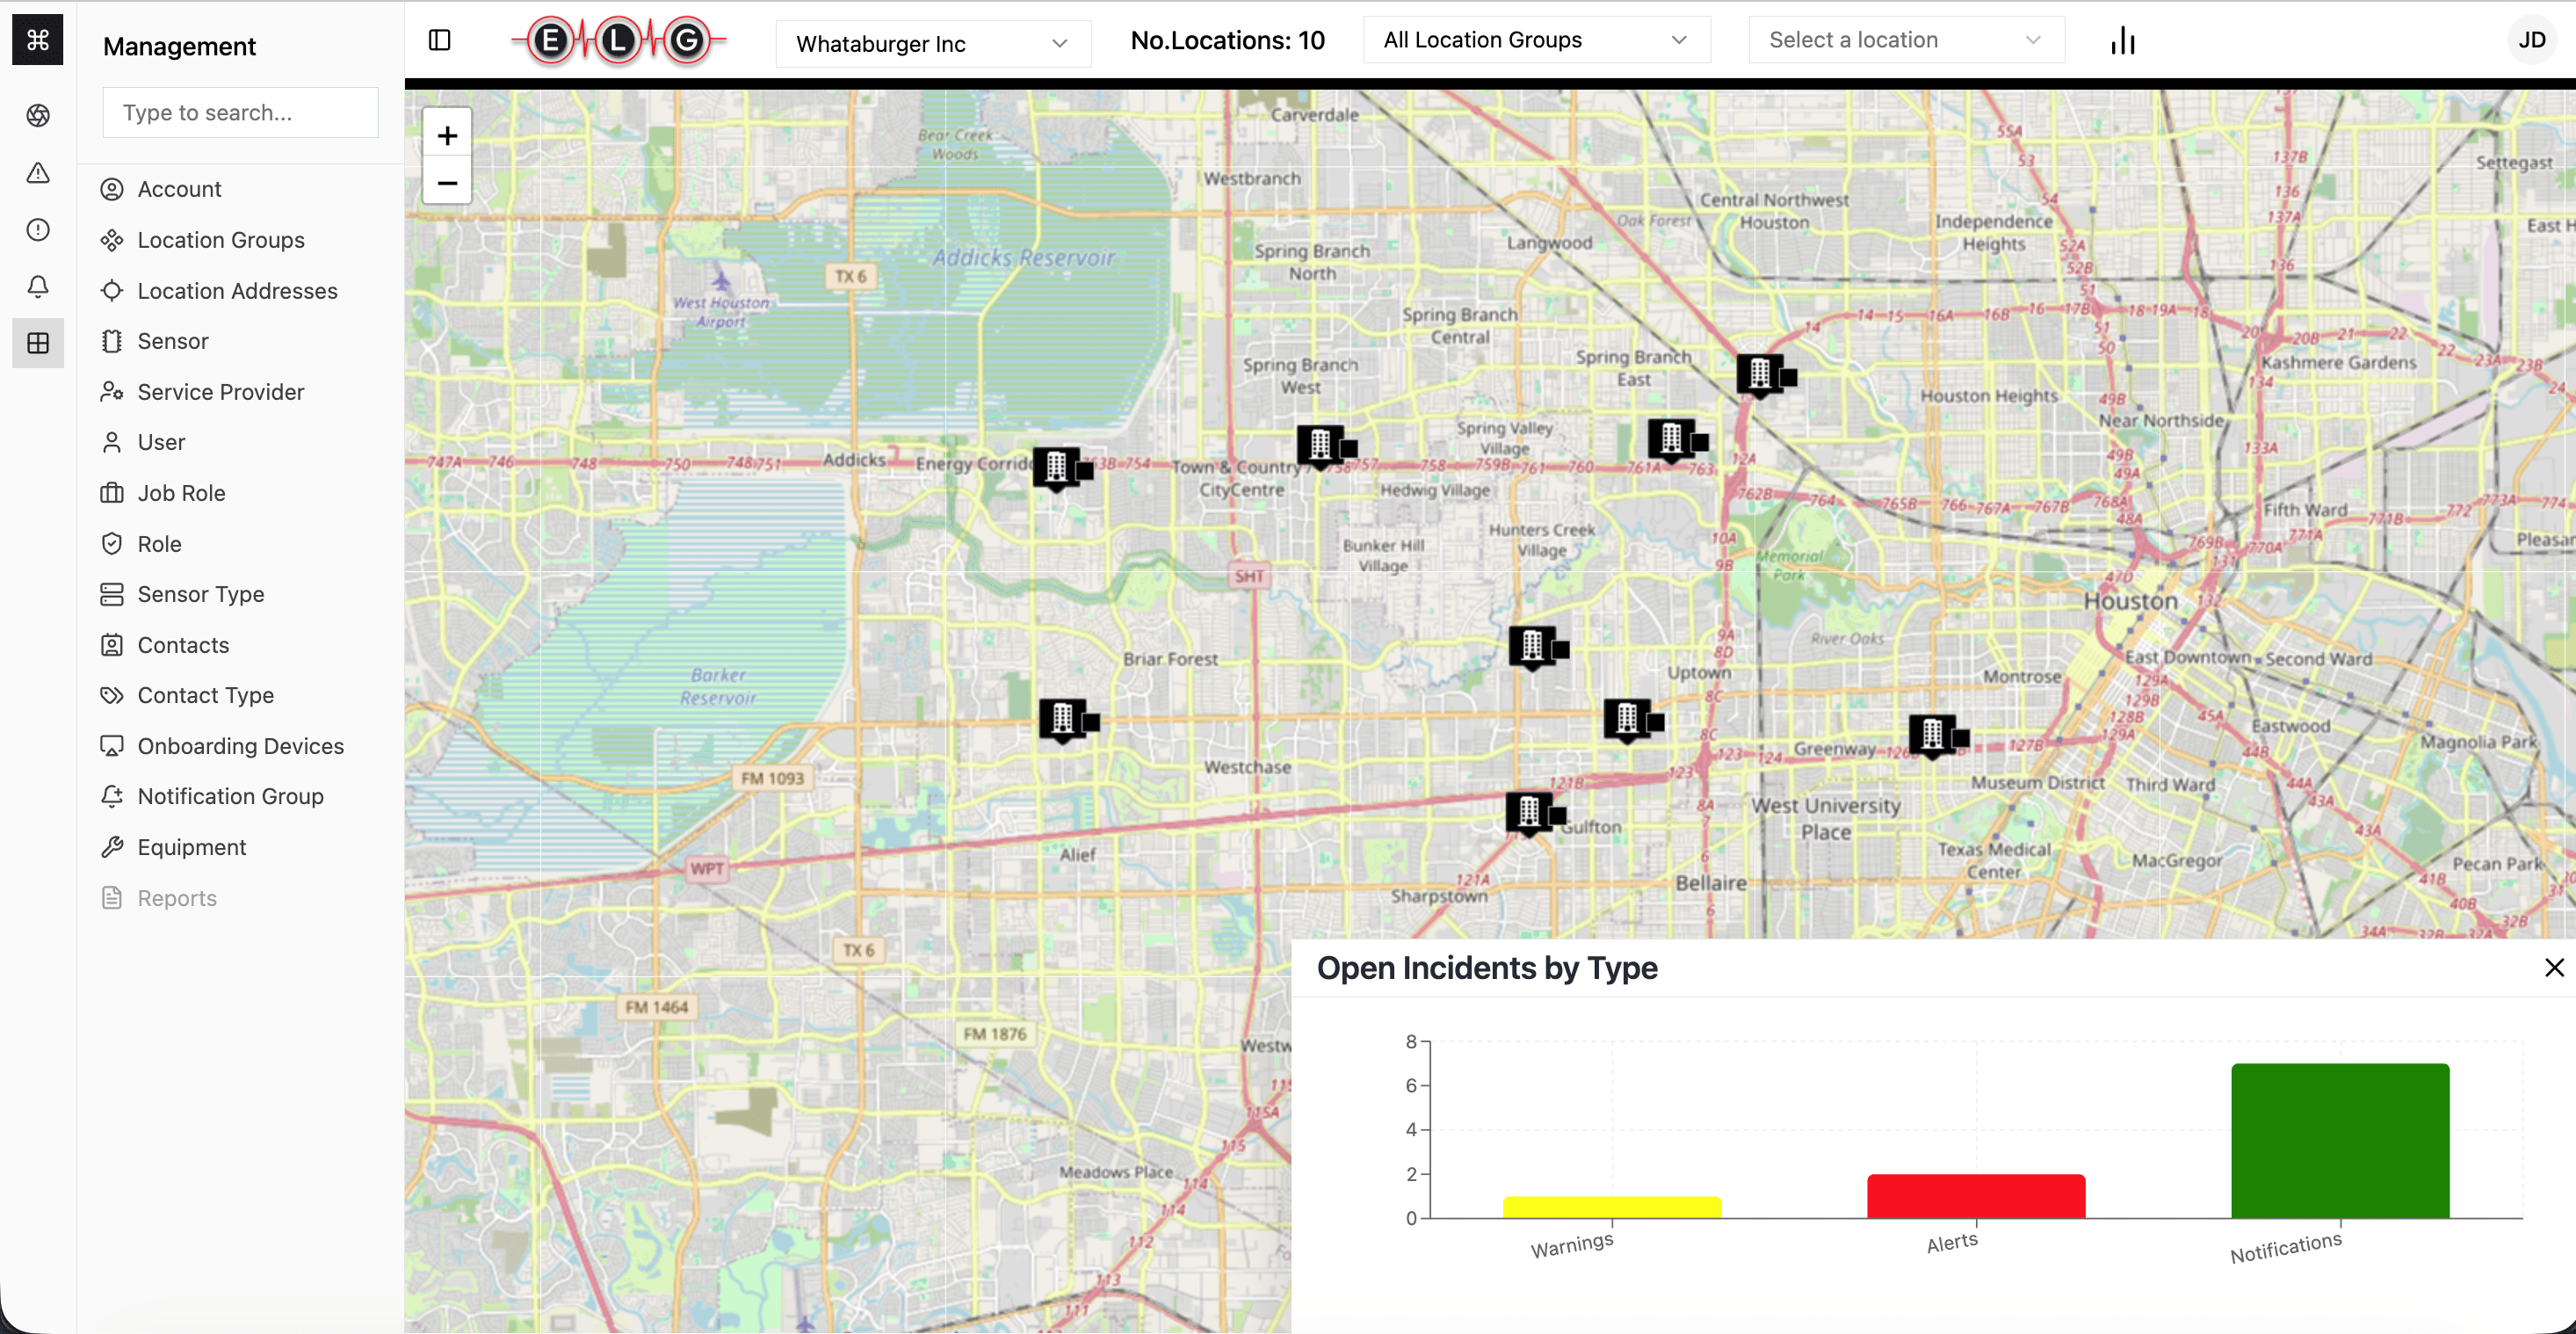
A bold emergency-power website for Thor Power Technologies that introduces the ELG platform, explains AI-assisted grid monitoring, and helps utilities, municipalities, and critical businesses understand backup-power readiness at a glance.
The brand needed to explain a highly technical emergency-power system in a way that felt credible, clear, and easy to scan for decision-makers.
We positioned the site around the ELG story, used a dramatic hero section to establish the brand immediately, and structured the content into simple sections that explain what the system is, why it matters, and how it works. We also highlighted the platform vocabulary, hardware options, partner logos, recent articles, and direct contact details so visitors can quickly build trust and move toward inquiry.
An operations dashboard that helps tournament organizers run events with more control and less manual work.
A mobile-first cricket scoring platform built for scorers, teams, and fans to follow every ball in real time, even with unreliable connectivity.
A refined luxury perfume storefront designed to elevate discovery, reinforce authenticity, and convert premium fragrance shoppers with confidence.